EDR Evasion: A New Technique Using Hardware Breakpoints – Blindside

Utilizing hardware breakpoints to evade monitoring by endpoint detection and response (EDR) platforms and other control systems is not a new concept. Both threat actors and researchers alike have exploited breakpoints to inject commands and perform malicious operations.
Proof of Concept (PoC) techniques using Event Tracking for Windows (ETW) and the Windows Anti-Malware Scanning Interface (AMSI) have been available for some time. These include in-depth work such as that created by @rad9800 TamperingSyscalls and In-Process Patchless AMSI Bypass created by EthicalChaos – but in both cases, the attack is performed by hooking a specific function in the current process memory to manipulate it for an unintended purpose.
The Cymulate Offensive Research Group were able to extend the methodology into a new technique named “Blindside” to allow for the method to work on a broader scale. Instead of hooking a specific function, the Blindside technique instead loads a non-monitored and unhooked DLL and leverages debug techniques that could allow for running arbitrary code.
This permits more flexibility in what code can be executed outside the watchful eye of many commercial EDR and XDR platforms.
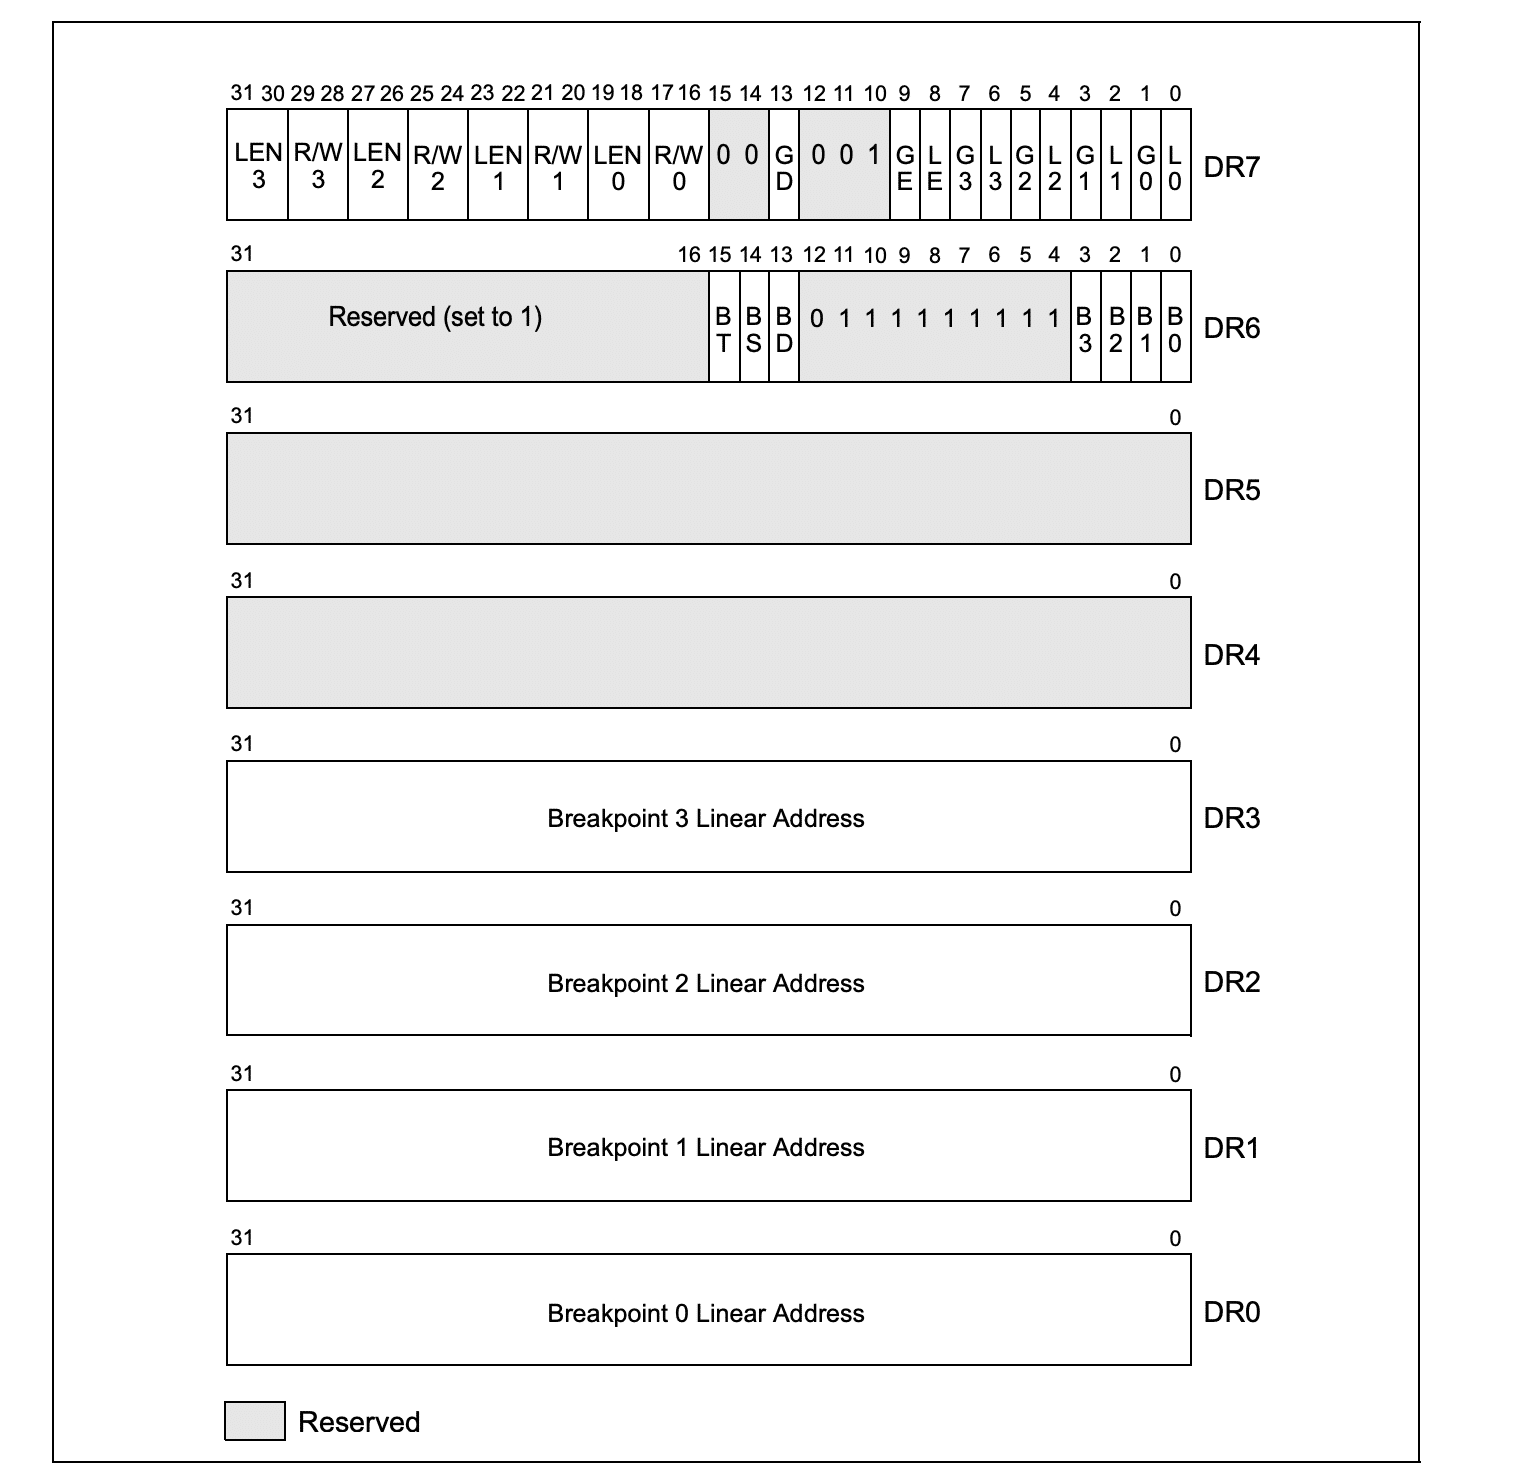
An Overview of Hardware Breakpoints and Debug Registers (DR0-DR7)
Since Blindside depends on hardware breakpoints, understanding how these breakpoints and debug registers function is essential.
What are Hardware Breakpoints and Debug Registers?
Hardware breakpoints are available on both x86 and x64 processors, containing eight debug registers: DR0 – DR7. These registers are 32- or 64-bits long, depending on the processor type, and control the monitoring of debugging operations.
Unlike software breakpoints—which are more familiar to Windows developers—hardware breakpoints allow for “memory breakpoints,” triggered when an instruction attempts to read, write, or execute a specified memory address (based on the breakpoint configuration). However, a limitation is that only a few hardware breakpoints can be active at any time.
Functions of Debug Registers (DR0-DR7)
- DR0-DR3: Hold the linear address of a breakpoint and are referred to as Debug Address Registers. A breakpoint triggers when the instruction matches the address in one of these registers.
- DR4-DR5: These are Reserved Debug Registers and are not used in this technique.
- DR6: Known as the Debug Status Register, it reports debug conditions sampled during the last exception.
- DR7: The Debug Control Register is crucial in the Blindside technique as it controls each breakpoint and its conditions.
The primary function of these debug registers is to set up and monitor up to 4 numbered 0 through 3. For each breakpoint, the following information can be specified:
- The linear address where the breakpoint is to occur.
- The length of the breakpoint location (1, 2, or 4 bytes).
- The operation will be performed at the address for a debug exception to be generated.
- Whether the breakpoint is enabled.
- Whether the breakpoint condition was present when the debug exception was generated.
Debug Exceptions
When it comes to exceptions in hardware breakpoints, there are two consequences here: a debug exception (#DB) and a breakpoint exception (#BP). For the purposes of the Blindside technique, the debug exception (#DB) is most important. When a breakpoint is triggered, the execution will be redirected to a handler - which is usually a debugger program or part of a more extensive software system. It is important to note that exceptions in the Blindside technique will only be triggered if they are a single-step exception.
Setting up the Blindside Technique
Step 1: The Breakpoint Handler
In preparing to utilize the technique, the first requirement is that a Breakpoint Handler is established. Here is an example of a handler in C++:
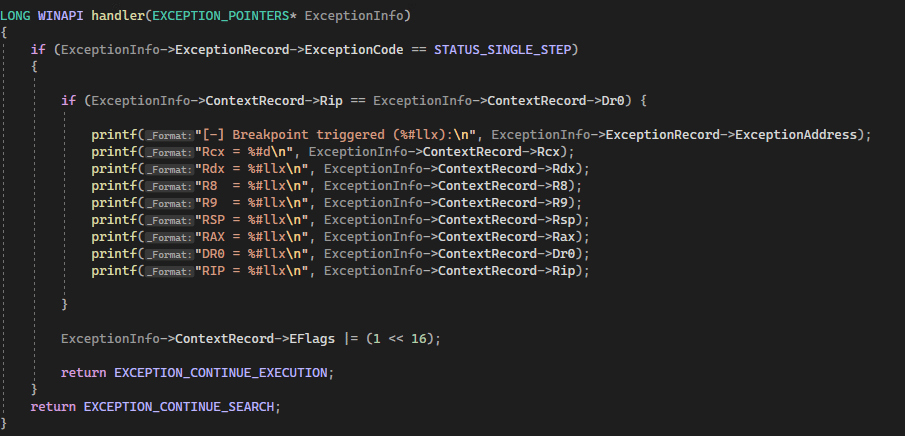
The function first checks if the exception code in the ExceptionRecord member of the EXCEPTION_POINTERS structure is EXCEPTION_SINGLE_STEP, which indicates that a single-step exception has occurred. If this is the case, the function then checks if the instruction pointer (Rip) in the ContextRecord member of the structure is equal to the value of the first debug register (Dr0). If this is also true, the function prints some information about the exception, including the exception address, the values of certain registers, and the value of the stack pointer (Rsp).
Finally, the function sets the resume flag (RF), and returns EXCEPTION_CONTINUE_EXECUTION to indicate that the execution should continue. If the exception code is not EXCEPTION_SINGLE_STEP, the function returns EXCEPTION_CONTINUE_SEARCH to indicate that the search for a handler should continue.
Technique Setup Part 2: Setting the Breakpoint
With the handler configured to deal with the exception, the next step in preparation is to create the actual breakpoint.
Using C++ as before, here is an example of the breakpoint configuration:
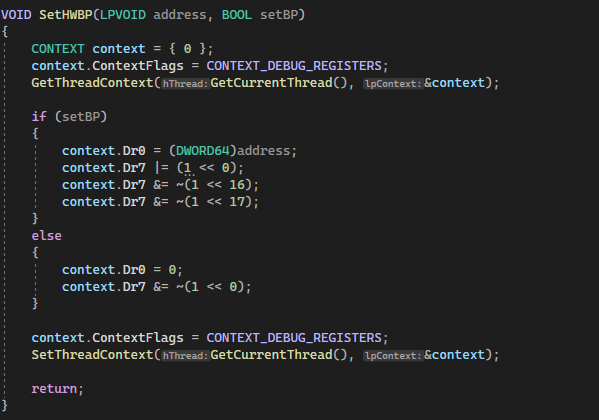
This function takes two parameters. The first is the address where the system should breakpoint on, and the second is to enable the breakpoint or disable it. The technique then takes the current context of the specified thread being acted on and stores it inside of a context variable. If the setBP variable is true, the code sets DR0 to the address the attacker wishes to break on. Note that the technique could have also been used Dr1, Dr2, or Dr3 to store the address if necessary. Following this, the execution sets the first bit of Dr7 to 1 to enable the breakpoint and clears bits 16 and 17 to break the execution.
Conversely, if the setBP variable is false, the code will clear Dr0 and do the same for the first bit of Dr7. Finally, the code sets the context of the thread for it to be updated.
Utilizing Blindside
While researching this topic, Cymulate reviewed the significant work on the general methodology that has been created by numerous research professionals. The Cymulate Offensive Research Group realized that a different technique to those already known could create a new process in debug mode, place a breakpoint on LdrLoadDll, and force only ntdll.dll to load. This creates a situation where the result is a clean version of ntdll, without hooks. An attacker could then copy the memory of the clean ntdll to an existing process and unhook all previously hooked syscalls.
When a process is first created, ntdll.dll will automatically be loaded, but additional dll’s will also come into play. By utilizing this technique, the breakpoint blocks the loading of the additional dll’s by hooking LdrLoadDLL and creates a process with only the ntdll in a stand-alone, unhooked state.

Walking Through the Blindside Technique
When looking at the entire process, the application of the Blindside technique can allow for an unmonitored process to run within the context of the Windows session as follows:
Step 1: Create a new process in debug mode

Step 2: Find the process address for LdrLoadDll
Because the process created is a targeted child process, it will have the same ntdll base address and the same address for LdrLoadDll. This means that the address for LdrLoadDll must be identified.

Step 3: Set the breakpoint
After finding the LdrLoadDll address, the next function required is to put a breakpoint on the remote process.
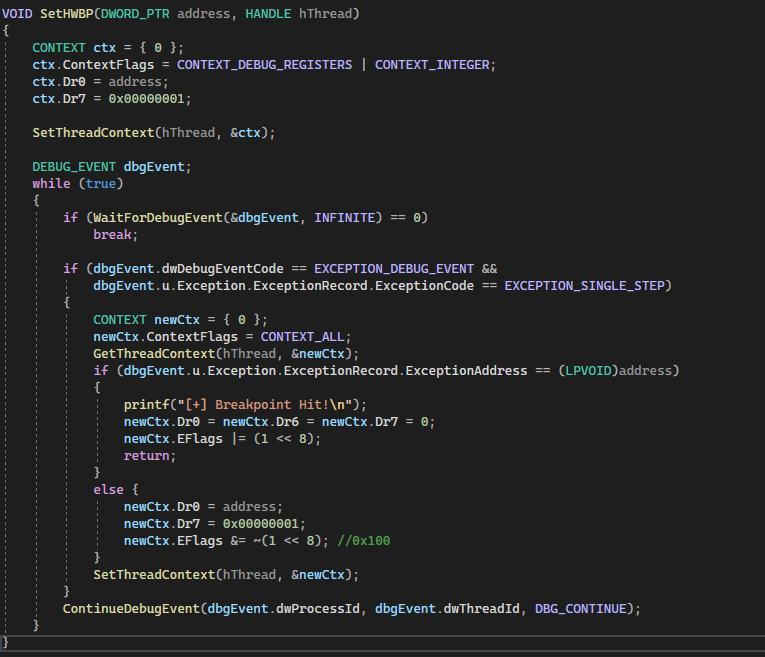
The function takes two arguments: the address at which the breakpoint should be set and a handle to the thread on which the breakpoint should be set.
The function first initializes a CONTEXT structure and sets its ContextFlags member to the bitwise OR of CONTEXT_DEBUG_REGISTERS and CONTEXT_INTEGER, which specifies that the structure should be filled with the current debug registers and integer registers of the thread. It then sets the value of the first debug register (Dr0) to the specified address and sets the 0th bit of the Dr7 register to enable the breakpoint.
Step 4: Wait for the breakpoint to trigger
Next, the function calls the SetThreadContext() function to apply the updated context to the thread. It then enters an infinite loop that waits for debug events using the WaitForDebugEvent() function. When a debug event is received, the function checks if it is an exception debug event with an exception code of EXCEPTION_SINGLE_STEP. If this is the case, the function retrieves the current context of the thread using the GetThreadContext() function and checks if the exception address matches the specified address.
If the exception address matches the specified address, the function will reset the Dr0, Dr6, and Dr7 registers and will return nothing, this is done to block the LdrLoadDll from loading other DLLs. Otherwise, it resets the breakpoint and continues execution by calling the ContinueDebugEvent() function with the DBG_CONTINUE argument. This loop continues until WaitForDebugEvent() returns 0, indicating that no more debug events are available.
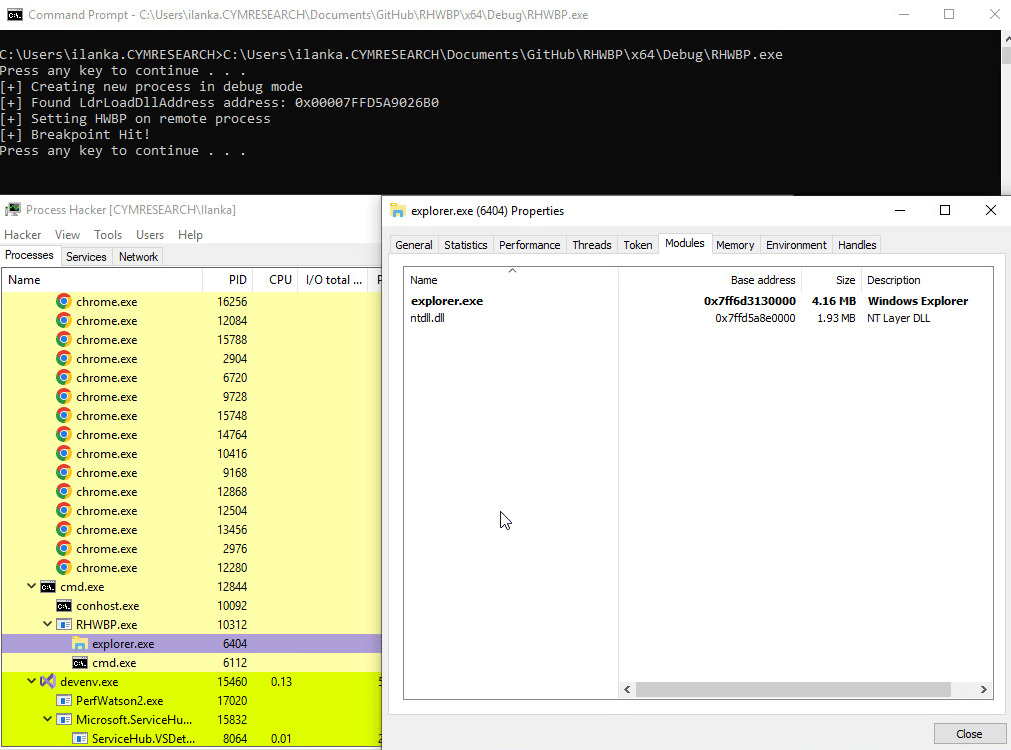
Step 5: Memory loading and unhooking
It is then necessary to copy the memory of ntdll into the target process and unhook any syscalls.

This function has one parameter, a handle, to the debugged process created. The base address of the debugged process will be identical to the ntdll base address. After reading the memory of ntdll using NtReadVirtualMemory, freshNtdll (the allocated buffer will store that memory information. It is now safe to terminate the original process as there is no further need for it.
Step 6: Overwrite hooks
Next, it is necessary to iterate through all to find the virtual address of the .text section of ntdll, change the protection to PAGE_EXECUTE_READWRITE, and copy the .text section of the new mapped buffer (freshNtdll) to the original hooked version of ntdll, which will result in the hooks being overwritten.
Step 7: Clean up
The last step to conclude this technique is to restore the original protection.
Mitigating Blindside
The Blindside technique is not immune to mitigation. Although it can bypass EDR (Endpoint Detection and Response) solutions relying on hooks to detect behaviors, several strategies can reduce its effectiveness and alert security teams when it is used.
1. Monitoring SetThreadContext Function Usage
The first mitigation method is to monitor the use of the SetThreadContext function. This function is frequently abused for malicious purposes. By inspecting the context, security teams can identify if an attacker has placed an address inside one of the Debug Address Registers (DR0-DR3). Any unexpected data written into these registers serves as a strong indicator of compromise. When combined with evidence of new DLL instances or other indicators, this activity can prompt anti-malware solutions to take action.
2. Tracking Suspicious Debug Functions and Registers
Another method involves monitoring debug functions to detect signs of malicious activity. While these functions run, EDR solutions should actively inspect the DR0-DR3 registers for suspicious behavior. If such activity is found, it is a clear indicator of a potential threat.
3. Adjusting EDR Settings for Better Detection
Even though Blindside may bypass EDR platforms in their default settings, adjusting protocols and profiles can enable these tools to monitor DR0-DR3 registers more effectively. If any of these registers contain a suspicious address, it signals that a process may be attempting to hook into them.
EDR technologies can correlate these actions with other malicious activities, such as attempts to create unhooked DLLs. With proper settings and configurations, the EDR can block the attack and terminate the offending process before it escalates.
Conclusion
While researching the viability of this technique, the Cymulate Offensive Research Group verified the efficacy of the technique against multiple EDR and XDR platforms commercially available. The result of this experimentation is that many – but not all – EDR/XDR systems could be bypassed using Blindside.
Cymulate will not be naming specific EDR/XDR tools that are vulnerable or not vulnerable due to confidentiality requirements, but vendors who were tested against were notified. Additionally, before the publication of the details of the technique, Cymulate filed a Microsoft Security Response Center report to allow Microsoft to be aware of the Blindside technique. As of this publication, Microsoft has declined to comment.
It is the hope of the Cymulate Offensive Research Group that the identification of the viability and efficacy of the Blindside technique against current versions of Windows (Desktop and Server) and multiple EDR/XDR products will result in a re-examination of hardware breakpoint handling in future.
References


